Both the Longer Term and Shorter Term analysis is supportive but tempered by the fact that the market is registering overbought technically and a number of our market sentiment measures are indicating, if not excessive enthusiasm, then certainly a high level of complacency. This doesn’t fire off immediate signals but makes us a little more cautious than would otherwise be the case.
Overbought? The percentage of stocks above their 50 day moving average within a market or index is a good market pulse indicator and is supportive when the number is greater than 50%. However, historically when the number gets above 80 the market has often stalled at least. Currently Nyse is reading 88% and UK (allshare) is at 87%. Also UK FTSE100 index has an overbought RSI (14) reading of 72, the highest since March 2010 (the RSI is the most popular indicator of price-rate-of-change used by market technicians).
Sentiment.
Consensus polls: We follow quite a few including the popular public investors poll by AAII which reported Bulls% higher last week at 46.4% (from 38.7%). That’s quite a jump and equal with w/e 21st December as the highest Bulls% since Feb 2012. Just to remind you, sentiment indicators are to be viewed from a Contrarian point of view, i.e. excessive bullishness is usually a warning (often an early warning).
Mutual Fund Flow: www.lipperusfundflows.com reported Equity Fund inflows of $18.3 billion in the week to 9th January. That is the largest (by far) single weekly inflow for years. I have to go back to September 2007 to find one higher. This is excessive bullishness and it lifted the inflow measured over four weeks to its highest level for years as well.
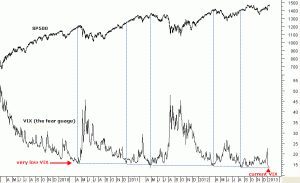
Volatility: The VIX, often called the fear guage closed on Friday at 13.36 which is the lowest since 2007. See the chart below.
As a further market timing tool we also look at the relative relationships between different asset classes. For years now when equities have been strong we have usually seen weak bonds and a weak dollar. Currently we would say that the US dollar index is in a weak position (good for equities) but US T-bonds are hinting they have found technical support following a two month decline and “may” start to rally. Should that happen it would usually imply weakness for equities. Of course if T-bonds break below that Support it would imply further weakness for bonds and therefore further strength for equities.
To summarise: both the Longer Term and Shorter Term analysis is supportive but we have reservations based on the above and to repeat last week’s comment, “Only if price confirms weakness by breaking support would we consider lowering our current beta. Otherwise, should the market correct a little we would view it as an opportunity”.
